


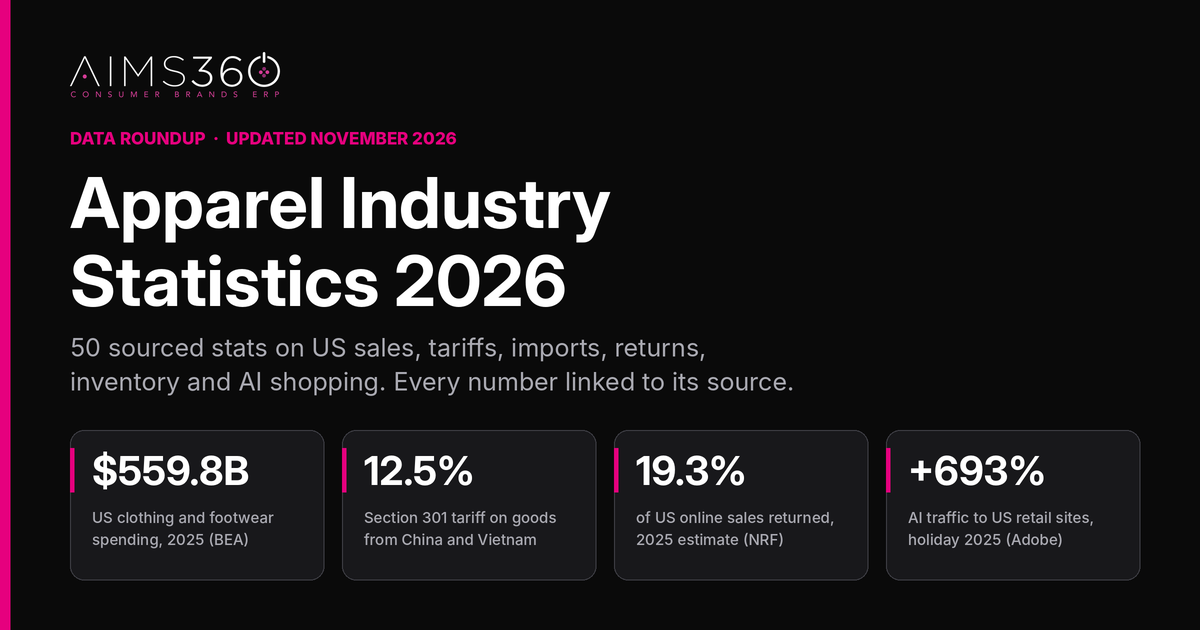

Last updated: November 4, 2026 · By Shahrooz Kohan, CEO of AIMS360
Key apparel industry statistics for 2026
- $559.8 billion: US consumer spending on clothing and footwear in 2025 (BEA)
- $218.3 billion: US clothing store sales, January to September 2026, up 5.3% (Census)
- 3.4%: rise in US apparel prices, September 2025 to September 2026 (BLS)
- 12.5% and 10%: Section 301 forced labor tariffs on apparel source countries since July 24, 2026 (USTR)
- 24.6%: average effective tariff rate on US apparel imports in 2025 (AAFA)
- Vietnam: top supplier of US cotton and man-made-fiber apparel in 2025 (Texas Tech, OTEXA data)
- 19.3%: of US online sales retailers expected to be returned in 2025 (NRF)
- 54%: higher conversion from AI-referred shoppers on US retail sites in May 2026 (Adobe)
This page collects 50 apparel and fashion industry statistics for 2026, mostly for the US market. Every number links to the agency, company or research group that published it, with the period it covers and the date it came out. Where we did the math ourselves, or had to cite a news outlet because the original was paywalled, we say so. See how we compiled these statistics.
Disclosure: AIMS360 makes ERP software for apparel brands. No source paid to be on this page, and we don't sell any of this data.
Apparel market size statistics
- US consumers spent $559.8 billion on clothing and footwear in 2025, up 5.7% from $529.7 billion in 2024.Source: U.S. Bureau of Economic Analysis, personal consumption expenditures on clothing and footwear, via FRED, updated September 30, 2026. Our calculation for the 5.7% growth.
- Global retail sales of apparel and footwear grew 2% in 2024, in current terms.Source: Euromonitor International, Apparel and Footwear Industry Overview, January 24, 2025.
- The US and China together made up 44% of global apparel and footwear sales in 2025, according to Euromonitor International.Source: FashionUnited, reporting a Euromonitor talk at Source Fashion London, January 15, 2026. Secondary source: the original data is paywalled or blocked.
- McKinsey and The Business of Fashion expect only low single-digit growth for the global fashion industry in 2026.Source: McKinsey & Company and The Business of Fashion, The State of Fashion 2026, November 17, 2025.
- US apparel prices were 3.4% higher in September 2026 than a year earlier (not seasonally adjusted), and rose 0.3% from August (seasonally adjusted).Source: U.S. Bureau of Labor Statistics, Consumer Price Index, September 2026, October 14, 2026.
What it means for brands: dollar growth includes price increases. When you compare this year's sales to last year's, check units and sell-through too, not just revenue. Our sell-through calculator and pricing and margin calculator can help.
US clothing sales and e-commerce statistics
- US clothing and clothing accessories stores sold $26.5 billion in September 2026, up 5.0% from September 2025 (advance estimate).Source: U.S. Census Bureau, Advance Monthly Retail Sales, September 2026, October 15, 2026.
- US clothing store sales reached $218.3 billion in January to September 2026, up 5.3% from the same months of 2025 (advance estimate, not seasonally adjusted).Source: U.S. Census Bureau, Advance Monthly Retail Sales, September 2026, October 15, 2026.
- US clothing and clothing accessories stores sold about $299.9 billion in 2025, up 5.2% from about $285.2 billion in 2024.Source: U.S. Census Bureau, Monthly Retail Trade, via FRED, updated October 15, 2026. Our sum of the 12 monthly Census estimates, not a single published figure.
- US retail e-commerce sales were $340.2 billion in the second quarter of 2026, up 12.2% from the second quarter of 2025 (all retail categories, seasonally adjusted).Source: U.S. Census Bureau, Quarterly Retail E-Commerce Sales, Q2 2026, August 18, 2026.
- E-commerce was 17.1% of total US retail sales in the second quarter of 2026, up from 16.3% a year earlier (all retail categories).Source: U.S. Census Bureau, Quarterly Retail E-Commerce Sales, Q2 2026, August 18, 2026.
Good to know: the Census "clothing and clothing accessories stores" category counts sales at clothing stores only. Apparel sold by department stores, mass merchants and online-only sellers is counted elsewhere, so total US apparel sales are higher. Census doesn't publish a quarterly apparel-only e-commerce number.
Wholesale vs DTC statistics
- Wholesale made up about 61% of NIKE Brand revenues in fiscal 2026. Wholesale revenues rose 6% to $27.5 billion while NIKE Direct revenues fell 6% to $17.7 billion. Nike's figures include footwear and equipment.Source: NIKE, Inc., fiscal 2026 fourth quarter and full year results, June 30, 2026. The 61% share is our calculation: $27.5 billion of $45.2 billion NIKE Brand revenues.
- Direct-to-consumer sales were 49% of Levi Strauss & Co. net revenues in fiscal 2025, both in the fourth quarter and for the full year.Source: Levi Strauss & Co., fourth quarter 2025 results, January 28, 2026. Fourth quarter share as reported; the full-year share is our calculation from the company's figures.
- Retailers and brands transact nearly $3 billion a year in wholesale volume on Faire, across all product categories (company-reported).Source: Faire, via Business Wire, June 18, 2026.
- Merchants on Shopify processed $119 billion in gross merchandise volume in the third quarter of 2026 (global, all categories).Source: Shopify, Q3 2026 financial results, November 3, 2026.
What it means for brands: even the brands that pushed hardest into DTC still sell a big share through wholesale. For most apparel companies it isn't wholesale or DTC, it's both, run from one pool of inventory. More on the trade-offs in wholesale vs retail in apparel and our State of the Apparel Industry 2026 report.
Apparel import statistics
- US apparel imports fell 1.7% to $77.9 billion in 2025.Source: Fibre2Fashion, reporting OTEXA (U.S. Department of Commerce) data, March 11, 2026. Secondary source: the original data is paywalled or blocked.
- Vietnam passed China in 2025 as the largest supplier of US textile and apparel imports, with a 17.7% share of $104.1 billion in textile and apparel imports.Source: Fibre2Fashion, reporting OTEXA data, March 11, 2026. Secondary source: the original data is paywalled or blocked.
- US imports of cotton and man-made-fiber (MMF) apparel totaled $72.7 billion in 2025, down from $74.0 billion in 2024. This covers cotton and MMF apparel only, so it's lower than the all-apparel total.Source: Texas Tech University, International Center for Agricultural Competitiveness, U.S. Apparel Imports under the 2025 Tariffs, October 2026.
- Vietnam was the top supplier of both cotton apparel (17.9% of US import value) and MMF apparel (26.6%) in 2025.Source: Texas Tech University, U.S. Apparel Imports under the 2025 Tariffs (OTEXA data), October 2026.
- China's share of US MMF apparel imports fell to 18.2% in 2025, from a 29.4% average in 2020 to 2024, and was 13.3% in January to June 2026. Its share of cotton apparel imports fell from 13.8% to 8.2%, then 6.6%.Source: Texas Tech University, U.S. Apparel Imports under the 2025 Tariffs (OTEXA data), October 2026.
- US cotton and MMF apparel imports totaled $32.7 billion in January to June 2026, with import value down 8.5% for cotton and 8.2% for MMF from the same months of 2025.Source: Texas Tech University, U.S. Apparel Imports under the 2025 Tariffs, October 2026.
| Supplier | Fiber group | 2020 to 2024 average | 2025 | Jan. to June 2026 |
|---|---|---|---|---|
| Vietnam | Cotton | 16.0% | 17.9% | 17.8% |
| Bangladesh | Cotton | 13.8% | 15.3% | 16.6% |
| India | Cotton | 8.7% | 10.3% | 9.6% |
| China | Cotton | 13.8% | 8.2% | 6.6% |
| Cambodia | Cotton | 5.4% | 6.6% | 6.1% |
| Vietnam | MMF | 22.2% | 26.6% | 28.5% |
| China | MMF | 29.4% | 18.2% | 13.3% |
| Indonesia | MMF | 5.6% | 6.7% | 7.4% |
| Bangladesh | MMF | 5.0% | 6.5% | 6.7% |
| Cambodia | MMF | 3.6% | 5.7% | 6.2% |
What it means for brands: sourcing has moved fast. If you're shifting production between countries, your cost sheets, lead times and duty rates change with it. See ERP for apparel importers.
Apparel tariff statistics, 2025 to 2026
Checked November 4, 2026. US tariff rules have changed several times since early 2025 and are still being challenged in court. Confirm current rates for your HTS codes with your customs broker before you price.
| When | What changed |
|---|---|
| 2025 | IEEPA "reciprocal" and other tariffs were added on top of regular duties. AAFA puts the 2025 average effective tariff rate on US apparel imports at 24.6%. |
| February 20, 2026 | The Supreme Court ruled 6-3 that IEEPA does not authorize the President to impose tariffs. |
| February 24 to July 24, 2026 | A temporary 10% import surcharge under Section 122 applied to most US imports. |
| Since July 24, 2026 | Section 301 forced labor tariffs: 12.5% on goods from China and Vietnam, 10% on goods from Bangladesh, Cambodia, India, Indonesia, Pakistan, Sri Lanka, Mexico, Canada, Honduras, Guatemala and El Salvador. |
| July 1, 2027 | The $800 de minimis duty exemption ends by law. It's already suspended. |
- On February 20, 2026, the US Supreme Court ruled 6-3 that IEEPA does not authorize the President to impose tariffs, which ended the 2025 IEEPA "reciprocal" tariffs.Source: Supreme Court of the United States, Learning Resources, Inc. v. Trump, No. 24-1287, February 20, 2026.
- A temporary 10% import surcharge under Section 122 of the Trade Act of 1974 applied to most US imports from February 24 to July 24, 2026. Some goods were excepted, including CAFTA-DR textile and apparel goods entered duty free.Source: Proclamation 11012, Federal Register, February 25, 2026.
- Since July 24, 2026, Section 301 forced labor tariffs add 12.5% on goods from China and Vietnam and 10% on goods from Bangladesh, Cambodia, India, Indonesia, Pakistan, Sri Lanka, Mexico, Canada, Honduras, Guatemala and El Salvador. They stack on regular duties, and for China on the 2018 Section 301 tariffs. Some goods are exempt under the notice's annexes. The tariffs are being challenged at the US Court of International Trade, and duties are still due while the case is pending (Coppersmith, October 14, 2026).Source: Office of the US Trade Representative, Section 301 forced labor notice of action, July 23, 2026.
- US apparel imports faced an average effective tariff rate of 24.6% in 2025, near a record, according to AAFA. That rate includes IEEPA duties the Supreme Court later ruled unlawful.Source: American Apparel & Footwear Association, Fashion Tariffs 101, updated October 28, 2026.
- The effective duty rate on US cotton apparel imports rose 9.5 percentage points from 2024 to 2025, and 10.2 points for MMF apparel. Duties paid rose 75.7% and 51.2%. In January to June 2026, effective rates were still 6.5 and 5.2 points above the same months of 2025.Source: Texas Tech University, U.S. Apparel Imports under the 2025 Tariffs, October 2026.
- In mid-October 2025, the weighted average US tariff on apparel and footwear from the top 10 source countries was 36%, per McKinsey. This is a historical snapshot from before the Supreme Court ruling.Source: McKinsey & Company and The Business of Fashion, The State of Fashion 2026, November 17, 2025.
- The $800 de minimis duty exemption is suspended, and a 2025 law ends it for good on July 1, 2027. CBP processed over 1.36 billion de minimis shipments in fiscal 2024.Source: U.S. Customs and Border Protection, interim final rule, Federal Register, June 24, 2026.
What it means for brands: duty is now a moving part of landed cost, and it depends on country of origin. Our guide to tariffs and buying methods for apparel covers FOB, DDP and first sale.
Apparel return statistics
- US retailers estimated that 15.8% of 2025 sales, or $849.9 billion, would be returned, down from 16.9% in 2024 (all retail categories).Source: National Retail Federation and Happy Returns, 2025 Retail Returns Landscape, October 15, 2025.
- Retailers estimated that 19.3% of US online sales would be returned in 2025 (all retail categories).Source: National Retail Federation and Happy Returns, 2025 Retail Returns Landscape, October 15, 2025.
- More than $181 billion of global online purchases from the 2025 holiday season had been returned, 14% of purchases and 10% more than the year before (global, all categories).Source: Salesforce, 2025 holiday shopping data, page updated February 2, 2026.
- 25% of US online shoppers said they returned clothing bought online in the past 12 months, the most of any category in Statista's survey. That's a share of shoppers, not a return rate on sales.Source: Statista, Clothing and Shoes Are the Most Returned Online Purchases, April 28, 2025.
Good to know: we couldn't find a credible, published US return rate for apparel alone. Figures you see quoted for "fashion return rates" are often vendor estimates without a stated method. If you sell online, track your own return rate by style, size and reason code. Our returns management guide shows how.
Apparel inventory and markdown statistics
- US clothing stores held $2.02 of inventory for every $1 of monthly sales in August 2026, slightly leaner than $2.05 a year earlier. The ratio for all retailers was 1.36.Source: U.S. Census Bureau, Manufacturing and Trade Inventories and Sales, August 2026, October 15, 2026.
- Fashion inventory days on hand hit an all-time high in 2024, 14% above pre-2020 averages (global).Source: McKinsey & Company, What to expect in the global fashion industry in 2026, February 11, 2026.
- Inventory distortion cost retailers worldwide an estimated $1.73 trillion in 2025, including $572 billion lost to overstocks that needed deep discounts (all retail, global).Source: Board International, summarizing the IHL Group Inventory Distortion Study 2025, October 2025. Secondary source: the original data is gated.
- Online apparel discounts peaked at 25.1% off list price in the 2025 holiday season, deeper than 23.2% in 2024.Source: Adobe Digital Insights, 2025 holiday shopping season results, January 7, 2026.
What it means for brands: overstock ends up as markdowns. The usual fix is buying closer to real demand by style, color and size. See apparel inventory management best practices.
Online and AI shopping statistics
- US shoppers spent a record $257.8 billion online in the 2025 holiday season (November 1 to December 31), up 6.8% year over year.Source: Adobe Digital Insights, 2025 holiday shopping season results, January 7, 2026.
- US online apparel sales reached $49.0 billion in the 2025 holiday season, up 7.4% year over year.Source: Adobe Digital Insights, 2025 holiday shopping season results, January 7, 2026.
- Smartphones accounted for 56.4% of US online holiday transactions in 2025.Source: Adobe Digital Insights, 2025 holiday shopping season results, January 7, 2026.
- US holiday retail sales rose 3.1% to $972 billion in 2025, and NRF forecasts 4.2% growth in 2026 to $1.013 trillion.Source: National Retail Federation, 2026 holiday forecast, October 15, 2026.
- Adobe forecasts $275.1 billion in US online holiday spending for November and December 2026, up 6.7%.Source: Adobe Digital Insights, 2026 US Holiday Forecast, September 2026.
- Traffic from generative AI tools to US retail sites rose 693.4% in the 2025 holiday season, from a small base.Source: Adobe Digital Insights, 2025 holiday shopping season results, January 7, 2026.
- AI-referred traffic to US retail sites grew 393% year over year in the first quarter of 2026, and in March 2026 those visitors converted 42% better than other traffic.Source: Adobe Digital Insights, AI traffic grows but retail sites lag in AI search visibility, April 16, 2026.
- In May 2026, AI-referred visitors to US retail sites converted 54% better and brought 53% more revenue per visit than other traffic.Source: Adobe Digital Insights, Q3 AI Traffic Trends Report, June 2026.
- 39% of US consumers have used AI assistants for online shopping, in an Adobe survey of more than 5,000 people (March 2026).Source: Adobe Digital Insights, Q3 AI Traffic Trends Report, June 2026.
- 53% of US consumers who used generative AI for search in the second quarter of 2025 also used it to help them shop.Source: McKinsey & Company and The Business of Fashion, The State of Fashion 2026, November 17, 2025.
What it means for brands: AI assistants answer from the product data they can read: names, materials, sizes, colors, prices and stock. Clean, current product data now matters for search, marketplaces and AI shopping alike. See product management in AIMS360.
Apparel workforce and manufacturing statistics
- US apparel manufacturing employed 71,400 people in September 2026, down 9.3% from 78,700 a year earlier (preliminary).Source: U.S. Bureau of Labor Statistics, Employment Situation, Table B-1, October 2, 2026. Our calculation for the 9.3% decline.
- US apparel manufacturing jobs fell from 938,600 in January 1990 to 71,400 in September 2026, a drop of about 92%.Source: U.S. Bureau of Labor Statistics, Current Employment Statistics, via FRED, updated October 2, 2026. Our calculation for the 92% drop.
- There were 6,199 private apparel manufacturing establishments in the US in the first quarter of 2026 (preliminary). That counts locations, not companies.Source: U.S. Bureau of Labor Statistics, Industries at a Glance: Apparel Manufacturing, data as of October 30, 2026.
- The US apparel manufacturing industry employed 25,280 sewing machine operators in 2025, at a median wage of $17.37 an hour.Source: U.S. Bureau of Labor Statistics, Industries at a Glance: Apparel Manufacturing (OEWS data), data as of October 30, 2026.
- The US apparel, footwear and accessories industry directly employs 3.24 million American workers, according to AAFA. Most of those jobs are in design, sourcing, logistics and retail, not sewing.Source: American Apparel & Footwear Association, Fashion Tariffs 101, updated October 28, 2026.
What it means for brands: with fewer domestic factories, most US brands manage production through overseas or contract partners. Tracking each production stage by PO helps teams keep delivery dates. See production process tracking.
Statistics we couldn't verify
We looked for credible public data on retailer chargebacks and vendor compliance fines in apparel and didn't find any with a stated method and sample, so there's no chargeback number on this page. We also left out widely repeated fashion statistics that we couldn't trace back to a primary source. If you know of a solid source for either, tell us.
How we compiled these statistics
- Primary sources first. We started with US government data (Census Bureau, Bureau of Labor Statistics, Bureau of Economic Analysis, USTR, CBP, the Supreme Court), then company filings and results, then industry groups and research firms.
- Every figure checked at the source. We opened each publisher's page, report or PDF in early November 2026 and recorded the period the number covers and the date it was published.
- Clear labels. Where we did the math (growth rates, shares, annual sums), the stat says "our calculation". Where the original was paywalled or blocked, we cite the outlet that reported it and mark it as a secondary source.
- Scope. Most figures cover the US. Global figures say so. Several figures cover all retail, not apparel only, and say that too.
- Freshness. Census and BLS replace their monthly numbers every month, so the linked source may show a newer figure than this page.
How to cite this page
You're welcome to use these statistics with a link back. Please cite the original source for each figure, and this page as the roundup:
AIMS360. "Apparel Industry Statistics 2026: 50 Sourced Stats." Updated November 4, 2026. https://www.aims360.com/fashion-business-resources/apparel-industry-statistics
Frequently asked questions
How big is the US apparel market?
US consumers spent $559.8 billion on clothing and footwear in 2025, according to the Bureau of Economic Analysis, up from $529.7 billion in 2024. Clothing and clothing accessories stores alone sold about $299.9 billion in 2025, based on monthly Census Bureau estimates.
Are US clothing sales growing in 2026?
Yes. US clothing and clothing accessories stores sold $218.3 billion from January to September 2026, up 5.3% from the same months of 2025, according to Census Bureau advance estimates. Apparel prices were also 3.4% higher in September 2026 than a year earlier, so part of that growth is price.
What tariffs apply to apparel imports in 2026?
Since July 24, 2026, Section 301 forced labor tariffs add 12.5% on goods from China and Vietnam and 10% on goods from countries including Bangladesh, Cambodia, India, Indonesia, Pakistan, Mexico and Canada, on top of regular duties. The 2025 IEEPA tariffs ended after the Supreme Court ruling on February 20, 2026. Rates are being challenged in court and can change, so check with your customs broker.
Which country is the largest supplier of US apparel imports?
Vietnam. It was the top supplier of both cotton apparel (17.9% of US import value) and man-made-fiber apparel (26.6%) in 2025, according to a Texas Tech analysis of OTEXA data, and it passed China as the largest supplier of US textile and apparel imports overall.
What is the return rate for apparel?
There is no official US return rate for apparel alone. The National Retail Federation estimated that retailers would see 15.8% of 2025 sales returned, and 19.3% of online sales, across all categories. Clothing is the most returned online category in Statista's survey, where 25% of US online shoppers said they had returned clothing bought online in the past 12 months.
How many shoppers use AI to shop?
39% of US consumers have used AI assistants for online shopping, according to an Adobe survey from March 2026. In May 2026, shoppers who came to US retail sites from AI tools converted 54% better than other visitors, and AI traffic to retail sites rose 693.4% in the 2025 holiday season.
Do big apparel brands sell more through wholesale or DTC?
Both matter. Wholesale was about 61% of NIKE Brand revenues in fiscal 2026, based on Nike's reported figures, while direct-to-consumer was 49% of Levi Strauss and Co. net revenues in fiscal 2025.
How many people work in US apparel manufacturing?
About 71,400 people in September 2026, according to preliminary Bureau of Labor Statistics data, down from 938,600 in January 1990. The wider US apparel, footwear and accessories industry directly employs 3.24 million workers, according to AAFA.
How often is this page updated?
We checked every figure in early November 2026. Census and BLS publish new monthly figures, so the linked source may show a newer number than this page.
Running an apparel brand through all of this? AIMS360 is an apparel ERP for brands that sell wholesale, through EDI and DTC. Book a demo.


