.png)
Every list screen in AIMS360 is a grid you can shape. Filter with rules and groups, switch the same data between style, color and size views, pick and reorder every column, sort on several levels, pivot, save views by role and export to Excel. The Report Editor customizes the formatted reports. No reporting add on needed.

Every list screen in AIMS360 is a grid you can shape. Filter it with rules and groups, switch the same data between style, color and size views, pick and reorder every column, sort three levels deep, pivot it, save it as a view your team shares, and export it to Excel. When the built in report needs a different layout, the Report Editor changes it. No add on, no reporting app, no waiting for somebody else to run it.
In AIMS360, every list screen is a grid, and every grid is a report you can shape yourself. Orders, styles, customers, pick tickets, invoices, vendor purchase orders, cut tickets, returns: each one can be searched, filtered with rules and groups, re-columned, sorted, pivoted by style, color or size, saved as a named view and exported to Excel.
The Report Editor is the other half. AIMS360 ships hundreds of formatted reports, from invoices and packing lists to sales and inventory analysis. When one of them needs your layout, your fields or a table it does not already read, the Report Editor is where that happens.
Four things people ask for most, with the screens themselves, are below. Then an honest comparison with the reports a webstore gives you, and the three other ways to get at the same data: Live Excel, Power BI, or an AI assistant.
The filter builder works the way you think about the question. Add a rule for each condition, wrap rules in a group when they belong together, join them with AND or OR, and read the result back in plain English before you save it.
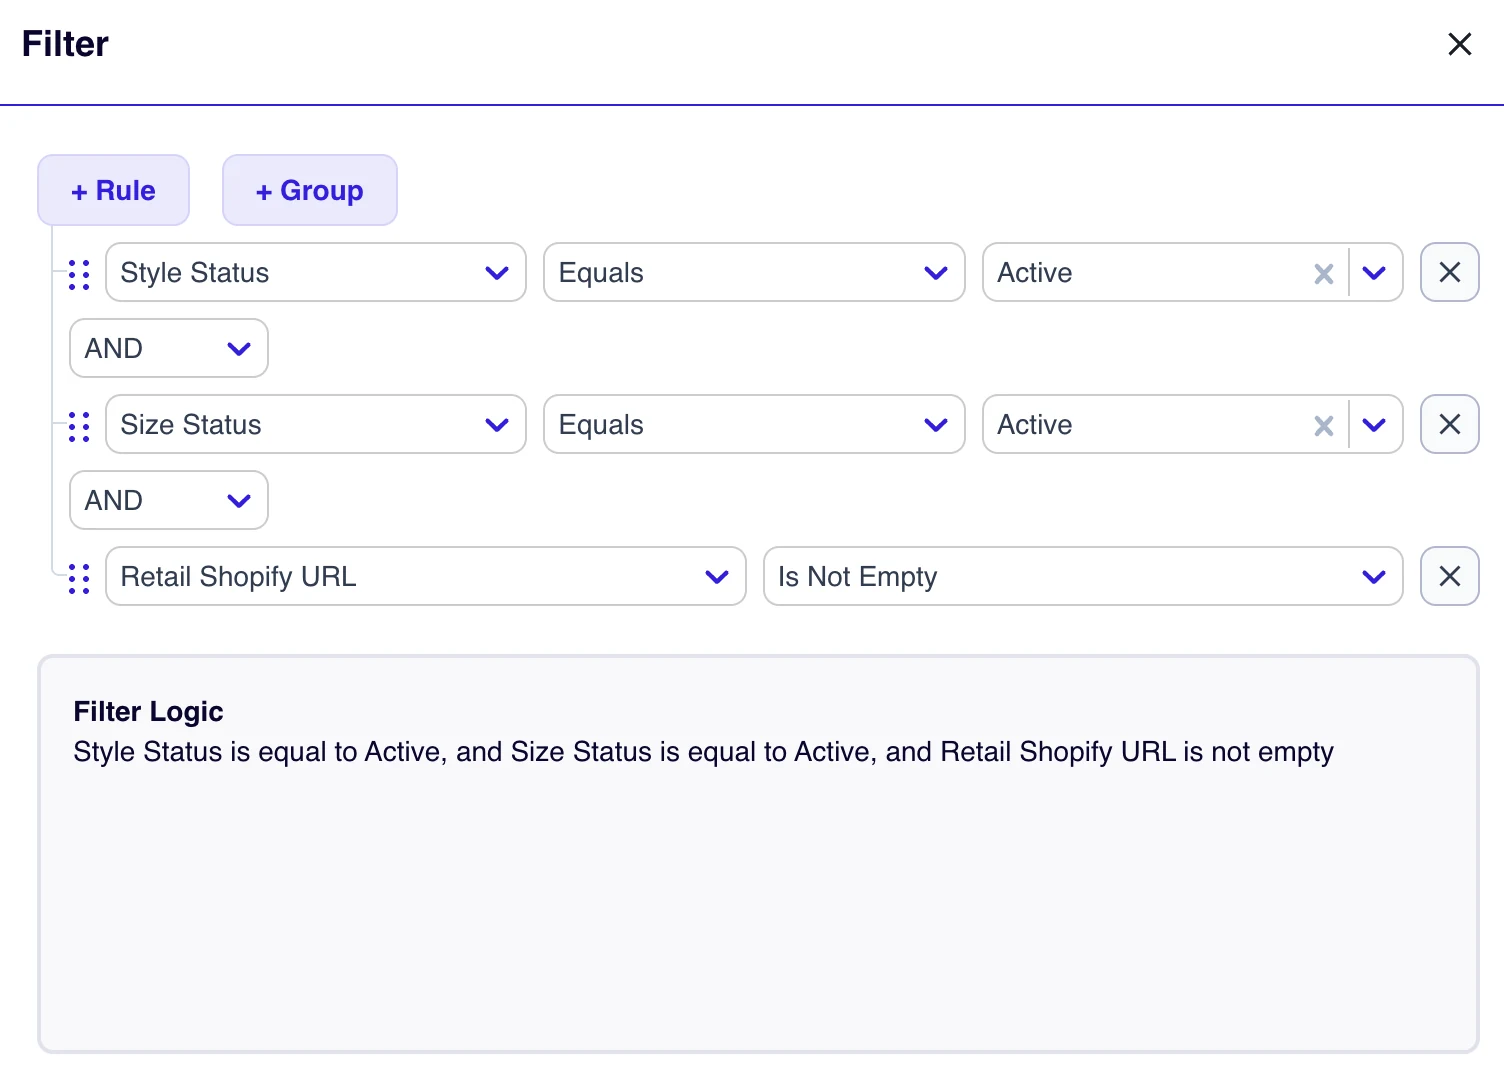
Save the result as a view and it is there tomorrow, for you or for the roles and users you assign it to. System views are locked, so a change to one of those becomes a new view under your own name rather than a surprise for everyone else.

Apparel data has a shape. A style breaks into colors, a color breaks into sizes, and the question changes depending on which level you are standing on. AIMS360 grids switch between those levels instead of making you rebuild the report.
The Columns and Sorting panel shows every column the screen can carry, which ones are on, what order they sit in, and how the grid sorts. Change any of it, preview, save.
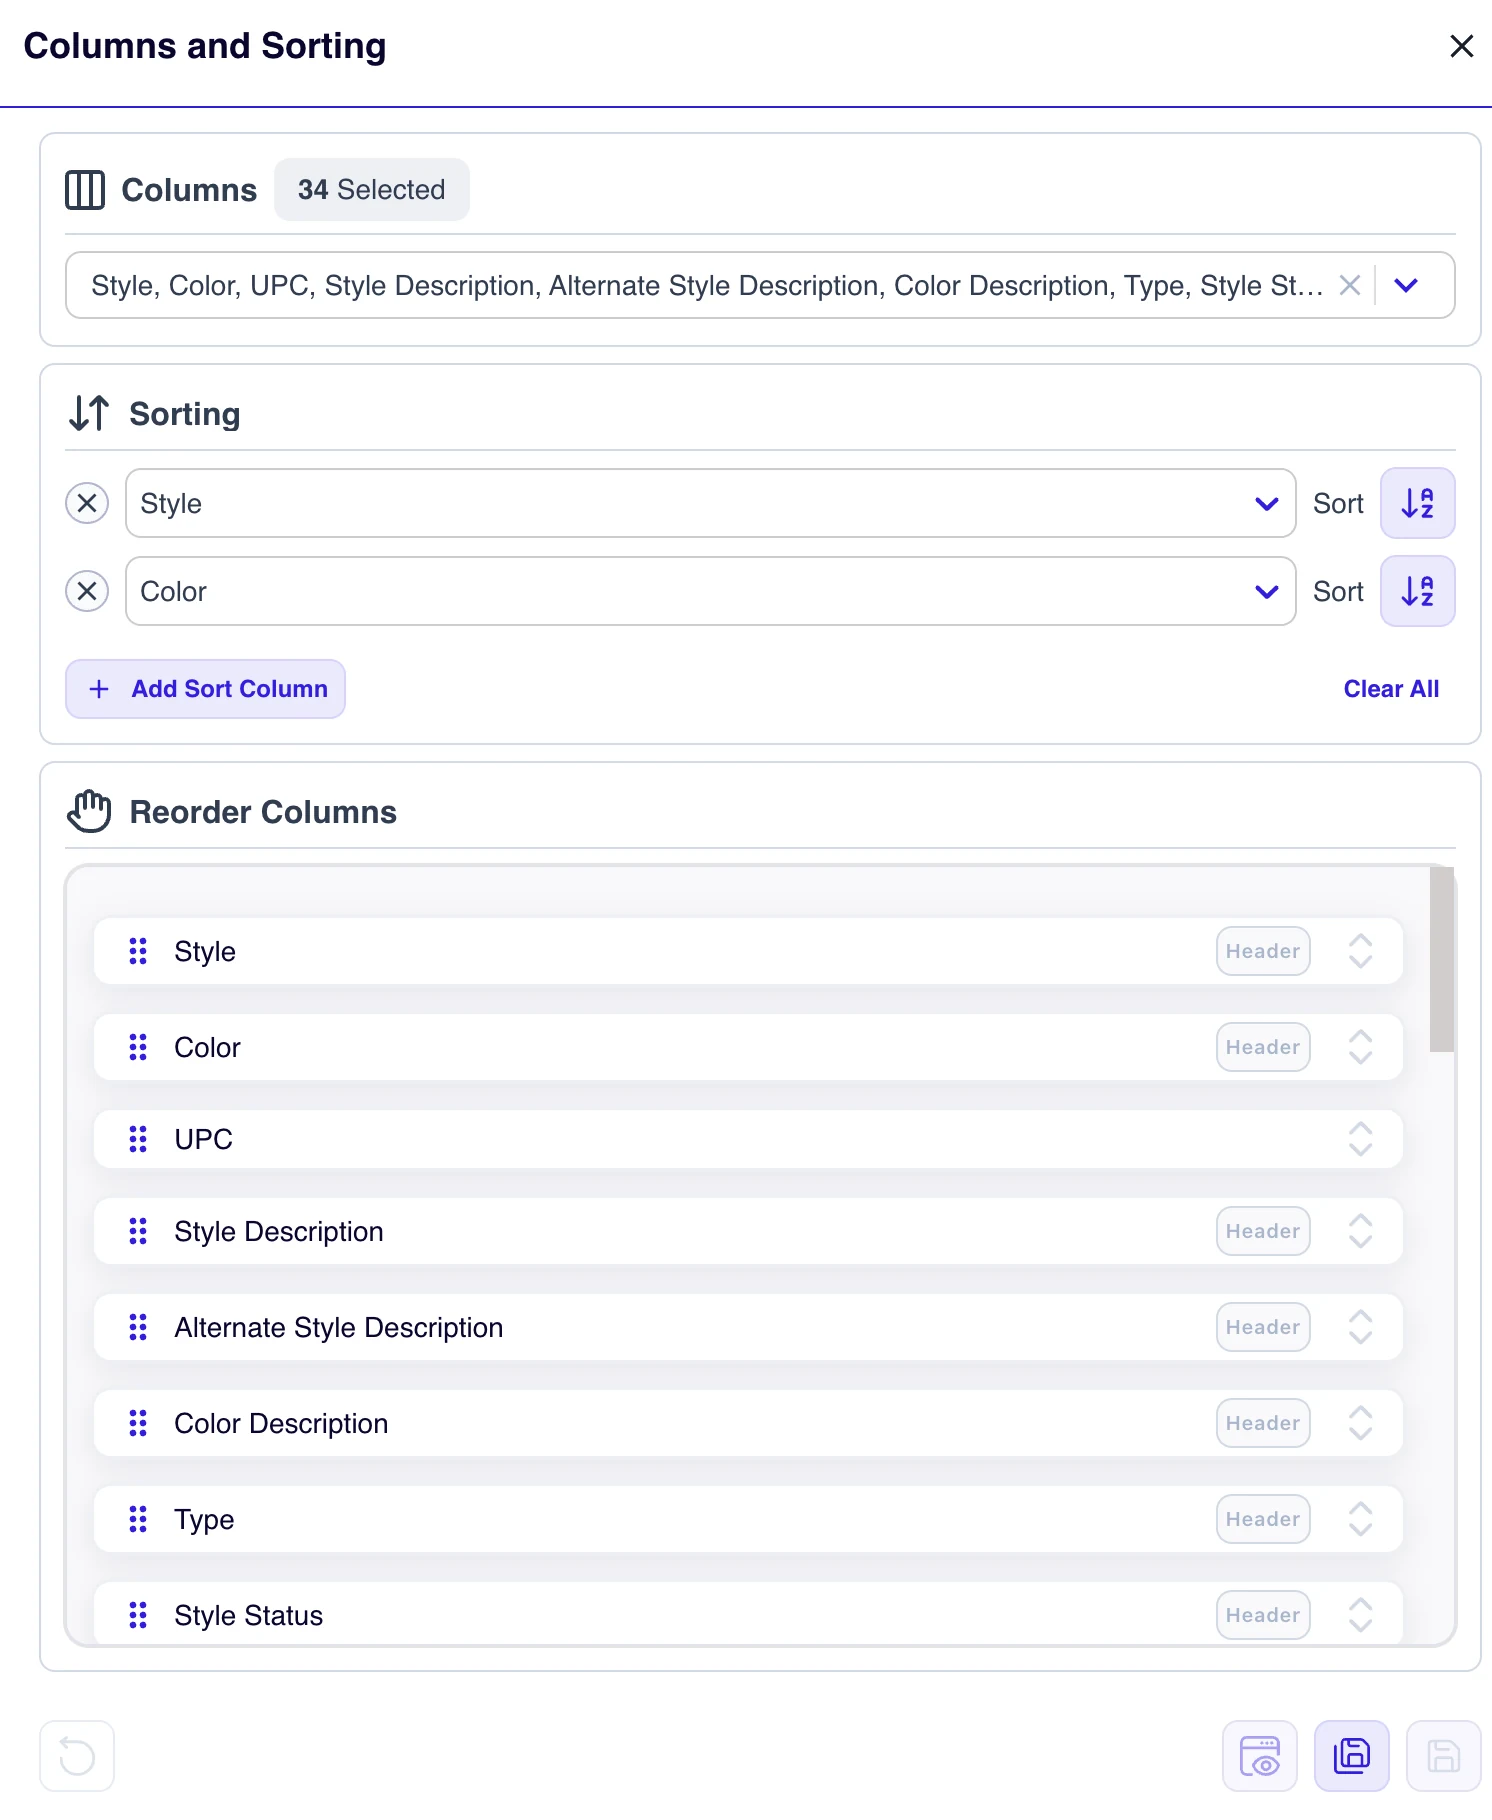
Views are also tidy. Hide the ones a team does not use, show the ones they do, and drag the tabs at the top of the screen into the order people actually work in.
Grids answer questions. Formatted reports go to customers, factories, banks and auditors, so they have to look right. The Report Editor is how a standard AIMS360 report becomes yours.
Open the standard report, save it under a new name, and edit the copy. The original stays intact for everyone else, and your version shows up wherever that report runs.
Move things, add a field the standard version leaves out, put your logo and terms where you want them, add a subtotal by color or a total by ship window.
Reports can read additional tables through the read only database connection, so a custom packing list can carry a value from somewhere the standard one never looked.
Some older reports are built in Crystal Reports, which needs its own license on your side. Newer reports use the built in report designer, which does not. Either way it is report writer work, so plan for somebody who knows one.
If nobody on your side wants to own the editor, tell us what the report has to show and we build it to that specification. Availability of custom report work depends on your plan.
Before anyone opens the editor, the Database Browser is worth a look: a read only window inside AIMS360 where an admin, or anyone granted the permission, can open any table, see the columns and the data, and export to Excel. It is the quickest way to learn where a field lives.
Shopify is a very good store. It is not an operating system for an apparel company, and its reports are honest about that: they cover the store. Here is where brands hit the edge, and what changes when the grid sits on the ERP instead.
| AIMS360 grids | A webstore's reports | |
|---|---|---|
| What it reports on | Every channel in one place: wholesale, EDI, dropship, DTC, retail stores, plus the warehouse, production and receivables behind them. | One webstore. Orders, products, customers and traffic for that store. |
| How it thinks about a product | A style, with colors and sizes underneath it, the way a merchandiser reads a line sheet. | A product with variants. Fine for a cart, awkward for a size run across 40 doors. |
| Large data sets | Search inside the current view or across all records, filter with rules and groups, pivot, then export the whole result. | Reports show a limited number of rows on screen; past that you export and work in a spreadsheet. |
| Getting a specific slice | Rules and groups, AND and OR, in-column filters, saved views shared by role. | Filters on the fields the report already exposes; anything else usually means a reporting app. |
| Standing reports | Save the view once. Schedule eligible views to refresh to a link on a daily, weekly or monthly cycle. | Scheduled delivery and combined views across sources usually come from an add on. |
| Formatted documents | The Report Editor shapes invoices, packing lists, statements and analysis reports to your layout. | Notifications and packing slips are templated; anything beyond that is an app or custom code. |
None of this is a knock on Shopify. It is the reason the reporting app category exists: once a brand sells wholesale and DTC at the same time, the store can only ever see part of the picture, and people bolt on tools to see the rest. AIMS360 is where the rest already is. Shopify orders flow into the same grids as EDI orders, dropship orders and store sales, at the style, color and size level, and the Shopify integration keeps the two in step.
Grids are for the question you need answered now, inside AIMS360. The same live data is reachable three other ways, and they are built for different habits.
A workbook wired to the API. Press refresh and the numbers update while your formulas and pivots stay put. Build it yourself or have us build it.
Live Excel reports → Standing dashboardMicrosoft Power BIPoint Power BI at your own database over a read only login, or at the API, and build the dashboard the whole team opens.
Power BI on AIMS360 data →The rule of thumb: grids for the question, the Report Editor for the document, Live Excel for the file finance lives in, Power BI for the dashboard everyone watches, and an AI assistant for the question nobody has asked before. Same data, same permissions.
Put a view on a daily, weekly or monthly cycle and AIMS360 refreshes the file at a URL. Sharing that URL is up to you: paste it into your own email, a shortcut, wherever. The link runs under the permissions of whoever scheduled it, so treat it like the data itself. One-off emailing of an export as an attachment is a separate feature on the desktop grids.
You cannot change the columns or filters on a view AIMS360 ships. You can copy it, change the copy, name it and hand it to the roles that need it. Most brands find the first month is spent building six good views and hiding twenty they never open.
Grids are for everyone. The editor is for somebody comfortable in a report designer, and a few older reports need a Crystal Reports license you buy from that vendor. If that is nobody on your team, tell us what the report has to show and we build it; what is available depends on your plan. For advanced filters, our implementation team will happily set them up with you so a view returns exactly what it should.
Every list screen in AIMS360, orders, styles, customers, pick tickets, invoices, purchase orders and the rest, is a grid. You can search it, filter it with rules and groups, choose and reorder its columns, sort it, pivot it by style, color or size, save the result as a named view, and export it to Excel.
Any field the grid exposes. Filters are built from rules and groups: a rule is one condition, a group bundles rules under AND or OR, and groups nest. While you build it, the filter logic is written out in plain English so you can check it says what you meant. There are also in-column filters for the quick cases and a search box that looks inside the current view or across all records.
A saved combination of filter, columns, column order and sort, with a name. AIMS360 ships system views for the common cases. You create your own from any grid, and you can make a view available to specific roles or specific users, so the customer service team and the warehouse see different cuts of the same orders.
No. Column arrangement and filters are locked on system views. Change anything and AIMS360 prompts you to save it as a new view, which is how it protects the standard views every module relies on.
Yes. AIMS360 keeps every unit at the style, color and size level, so the same grid switches between an All view, a By Color view and a By Size view without re-running anything. Pivot view on the list screens takes it further: pick the rows, columns and values, see the matrix, and export it if you want to keep it.
Customers, orders, styles, vendor purchase orders, cut tickets, garment dye, pick tickets, invoices and returns. Pivot view is temporary, so if you want the matrix later, export it to Excel.
Yes. The Columns panel lists every available column for the screen. Tick the ones you want, drag them into order, set which columns carry a header tag, preview the layout, then save it as part of a view.
Yes. Click any column header to sort ascending or descending, or add sort columns in the Columns and Sorting panel. Each sort carries a small number showing its priority, so style then color then size is a normal three level sort.
Filter and shape the grid first, then use the export option. On the desktop grids you can save the file locally or send it straight from the export dialog as an email attachment. In the browser grids you export the selected records.
Yes, for the views that are enabled for the job scheduler. Pick the module and the view, choose CSV or JSON, set a daily, weekly or monthly cycle, and AIMS360 refreshes the file at a link you can copy. Paste the link into your own email or a shortcut and anyone with it gets the latest run.
No, and it is worth being clear about that. The scheduler refreshes the file at a link; it does not send email. You share the link yourself. One-off emailing of an export as an attachment is a different feature, on the desktop grid export dialog.
The link runs under the permissions of the person who scheduled it. If you send it to someone who is not allowed to see financial data inside AIMS360, they will see everything in that file. Share links the way you would share the data itself.
The tool for changing the formatted reports AIMS360 prints and emails: invoices, packing lists, statements, order confirmations, sales and inventory analysis reports. Copy a standard report under a new name, then change the layout, add fields, add totals, or bring in extra tables from the read only database connection.
Yes, or know somebody who does. Some older reports are built in Crystal Reports, which needs its own license; newer reports use the built in report designer, which does not. If nobody on your side wants to own it, AIMS360 can build custom reports to a specification. What is available depends on your plan.
Yes. The Database Browser inside AIMS360 lets an admin, or anyone given the permission, open any table read only, see the columns and the data, and export to Excel. It is the fastest way to learn the schema before someone builds a Power BI model or a custom report.
You can, for the webstore. Shopify's reports are built around one store's orders and products, show a limited number of rows on screen, and do not know about your wholesale orders, EDI, dropship, warehouse or receivables. Slicing a size run across every channel, scheduling a standing report, or joining sources usually means adding a reporting app. AIMS360 already holds all of it at the style, color and size level, and every screen is a grid.
Views over large tables, an all orders view for example, can run to thousands of records, and the screen shows a page of several hundred at a time. Search defaults to the records in the current view and can be switched to all records. For the whole result, export it; for a standing large extract, schedule it.
Grids live inside AIMS360. If you want the same numbers as a standing dashboard, connect Microsoft Power BI to your database or the API. If you want them in a workbook that refreshes, use a Live Excel report. If you want to ask a question in plain English, the Claude, ChatGPT and Grok connectors answer from the same live data.
Grids, views, filters, pivot view, export and the scheduler are part of the platform. Custom report work by AIMS360, and some report editor routes, depend on your plan. Ask during your evaluation and we will tell you plainly.
Both. The browser screens have the views, filter builder, column tools and export shown on this page. The desktop screens have the grid export with email as an attachment, pivot view and the Report Editor. The data underneath is the same database.
Bring it to the demo. We will build the view in front of you, by style, color and size, and export it while you watch.


